THIS IS AN ARCHIVED SITE
This site contains information from January 2009-December 2014. Click HERE to go the CURRENT commerce.gov website.

Blog Category: 2010 Census

Census Bureau Projects U.S. Population of 315.1 Million on New Year's Day 2013

Map of U.S. with Jan 1, 2013 and population projection overlay

As our nation prepares to begin the New Year, the Commerce Department's U.S. Census Bureau projects that on January 1, 2013, the total United States population will be 315,091,138. This represents an increase of 2,272,462, or 0.73 percent, from New Year's Day 2012 and an increase of 6,343,630, or 2.05 percent, since the most recent Census Day (April 1, 2010).

Component Settings for January 2013:

  • One birth every 8 seconds
  • One death every 12 seconds
  • One international migrant (net) every 40 seconds
  • Net gain of one person every 17 seconds

U.S. POPClock Projection  |  NIST photo of U.S. Smart Grid 

The U.S. Department of Commerce wishes you a Happy 2013!


2010 Census: On-Time, Under-Budget, and Extremely Accurate

Image of Census bureau with social medai icons and website address

Guest blog post by Commerce Deputy Secretary Rebecca M. Blank

Yesterday's U.S. Census Bureau report shows that not only was the 2010 Census delivered on time and significantly under budget–but even more important, it was extremely accurate. I am proud of the extraordinary accomplishment by the Census Bureau and the Commerce Department in its success with the massive 2010 Decennial Census effort that gathered data vital to understanding our nation’s population and to allocating equal representation in our democratic system. The accuracy of the 2010 Decennial Census is particularly impressive considering outside predictions of failure. The Census was able to reverse a decades-long decline in survey response rates with its 2010 count.

The data released yesterday are from a post-enumeration survey of the 2010 Census called the Census Coverage Measurement (CCM) program, which measures the accuracy of the coverage of the nation’s household population (excluding the 8.0 million people in “group quarters,” such as nursing homes or college dorms). It surveys a sample of the 300.7 million people living in housing units and then matches the responses to the census, providing an estimate of exactly who was or wasn’t counted in the census. The results found that the 2010 Census had a very small net overcount–just 0.01 percent–which is statistically virtually the same as zero, and a significant improvement over the 0.49 percent overcount in 2000 and 1.61 percent undercount in 1990. You can learn more about how the Census Bureau conducts the CCM survey after the census to help measure its quality.

2010 Census Shows More than Half of Native Hawaiians and Other Pacific Islanders Report Multiple Races

Pie chart: More than Half of Native Hawaiians and Other Pacific Islanders Report Multiple Races

Commerce's U.S. Census Bureau released today a 2010 Census brief, The Native Hawaiian and Other Pacific Islander Population: 2010 (PDF), that shows more than half (56 percent) of this population, or 685,000 people, reported being Native Hawaiian and Other Pacific Islander in combination with one or more other races. This multiracial group grew by 44 percent from 2000 to 2010.

Overall, 1.2 million people, or 0.4 percent of all people in the United States, identified as Native Hawaiian and Other Pacific Islander (NHPI), either alone or in combination with one or more races. This population grew by 40 percent from 2000 to 2010. Those who reported being Native Hawaiian and Other Pacific Islander alone totaled 540,000, an increase of 35 percent from 2000 to 2010. The multiple-race Native Hawaiian and Other Pacific Islander population, as well as both the alone and alone-or-in-combination populations, all grew at a faster rate than the total U.S. population, which increased by 9.7 percent from 2000 to 2010.  Census press release

2010 Census Statistics Showed Asians Were Fastest-Growing Race Group

Director Groves at Profile America Forum

Commerce's U.S. Census Bureau counts every resident in the United States. It is mandated by Article I, Section 2 of the Constitution and takes place every 10 years. The data collected by the decennial census determine the number of seats each state has in the U.S. House of Representatives and is also used to distribute billions in federal funds to local communities.

Yesterday, the Census Bureau held "Profile America Forum on the Asian Population," a presentation on the release of a 2010 Census brief on the Asian population in the United States.

2010 Census Shows Interracial and Interethnic Married Couples Grew by 28 Percent over Decade

Infographic: 2010 Census Shows Interracial and Interethnic Married Couples Grew by 28 Percent over Decade

Commerce's Census Bureau Wednesday released a 2010 Census brief, Households and Families: 2010, (PDF) that showed interracial or interethnic opposite-sex married couple households grew by 28 percent over the decade from 7 percent in 2000 to 10 percent in 2010. States with higher percentages of couples of a different race or Hispanic origin in 2010 were primarily located in the western and southwestern parts of the United States, along with Hawaii and Alaska.

A higher percentage of unmarried partners were interracial or interethnic than married couples. Nationally, 10 percent of opposite-sex married couples had partners of a different race or Hispanic origin, compared with 18 percent of opposite-sex unmarried partners and 21 percent of same-sex unmarried partners. |  Full Census release

2010 Census Shows Asians are Fastest-Growing Race Group

Graph of the Percent Growth of the Asian Population 2000 to 2010

Commerce's Census Bureau has released a 2010 Census brief, The Asian Population: 2010 (PDF), that shows the Asian population grew faster than any other race group over the last decade. The population that identified as Asian, either alone or in combination with one or more other races, grew by 45.6 percent from 2000 to 2010, while those who identified as Asian alone grew by 43.3 percent. Both populations grew at a faster rate than the total U.S. population, which increased by 9.7 percent from 2000 to 2010.

Out of the total U.S. population, 14.7 million people, or 4.8 percent, were Asian alone. In addition, 2.6 million people, or another 0.9 percent, reported Asian in combination with one or more other races. Together, these two groups totaled 17.3 million people. Thus, 5.6 percent of all people in the United States identified as Asian, either alone or in combination with one or more other races.  Census press release

Census Bureau and National Urban League Host Forum on Black Population

High and members of the panel

The Commerce Department's U.S. Census Bureau today hosted a forum with the National Urban League on the black population at Black Entertainment Television studios in Washington, D.C. The event highlighted statistics from the 2010 Census, providing a portrait of the black population in the U.S. Following the presentation, an expert panel discussed the statistics and their implications. Kristal Lauren High of Politic365 moderated.

Joining Census Burea Director Robert Groves and other Bureau officials were National Urban League officials, including Marc Morial, chief executive officer and president. Experts on the panel from public and private universities and centers for population, political and economic studies responded to questions submitted via Facebook and Twitter and broadcast on the Census Bureau's Ustream channel.

In his remarks, Groves noted that today is the beginning of Black History Month. In 1976, as part of the nation’s bicentennial, the original 1926 Black History Week was expanded into a month. Each year, U.S. presidents proclaim February as National African-American History Month. The U.S. Census Bureau has gathered data and facts relating to Black History Month in its Facts for Features: February 2012.

2010 Census Shows Nearly Half of American Indians and Alaska Natives Report Multiple Races

National Museum of the American Indian Director Kevin Gover (Photo: Heather Schmaedeke )

U.S. Census Bureau Director Robert Groves released a 2010 Census brief on the American Indian and Alaska Native population (PDF) yesterday and joined an expert panel in addressing the current social and economic impact of this population and at a forum held at the National Museum of the American Indian. The event highlighted statistics from the 2010 Census, providing a portrait of the American Indian and Alaska Native population in the U.S. and its size and growth at various geographic levels.

The brief, The American Indian and Alaska Native Population: 2010, shows almost half (44 percent) of this population, or 2.3 million people, reported being American Indian and Alaska Native in combination with one or more other races. This multiracial group grew by 39 percent from 2000 to 2010.  Census infograph

Census Bureau Projects U.S. Population of 312.8 Million on New Year's Day 2012

Map of U.S. with "312,780,968" superimposed

As our nation prepares to ring in the new year, the Department of Commerce's U.S. Census Bureau projects the January 1, 2012, total United States population will be 312,780,968. This would represent an increase of 2,250,129, or 0.7 percent, from New Year's Day 2011, and an increase of 4,035,430, or 1.3 percent, since Census Day (April 1, 2010). The Bureau continues to analyze and disseminate the data gathered from the 2010 Census.

In January 2012, one birth is expected to occur every eight seconds in the United States and one death every 12 seconds.

Meanwhile, net international migration is expected to add one person to the U.S. population every 46 seconds in January 2012. The combination of births, deaths and net international migration results in an increase in the total U.S. population of one person every 17 seconds.  More Holiday Facts for Features

The U.S. Department of Commerce wishes you a Happy 2012!

U.S. Census Bureau: 2011 A Year of Successes and Anticipating 2012

In 2011, the Commerce Department's U.S. Census Bureau continued to provide quality statistics to governments and businesses to inform the decisions that affect everyone’s lives. These statistics touch every aspect of Americans’ lives–health, crime, income, education, labor force participation, housing conditions, consumer expenditures and a host of others.

While we have plenty to be proud of, here we highlight some of this year’s big successes.

Innovating Efficiencies:

The Census Bureau is building on the $1.9 billion in savings from the 2010 Census last year by looking for ways to innovate, become more efficient and to save money. The Improving Operational Efficiencies program has generated thousands of ideas from staff, including saving $24 million over a five-year period alone by consolidating IT storage and establishing an enterprise storage area network. We've also worked to streamline our regional office structure. By realigning the field infrastructure, the Census Bureau is saving taxpayer money and keeping pace with current developments in survey work worldwide. The restructuring is projected to result in $15 to $18 million in annual savings to the Federal government commencing in FY 2014. The Census Bureau is striving to be a responsible steward of taxpayer money and, like many in the current economic climate, is committed to the basic premise of doing more with less.

Delivering 2010 Census Products and ACS Data:

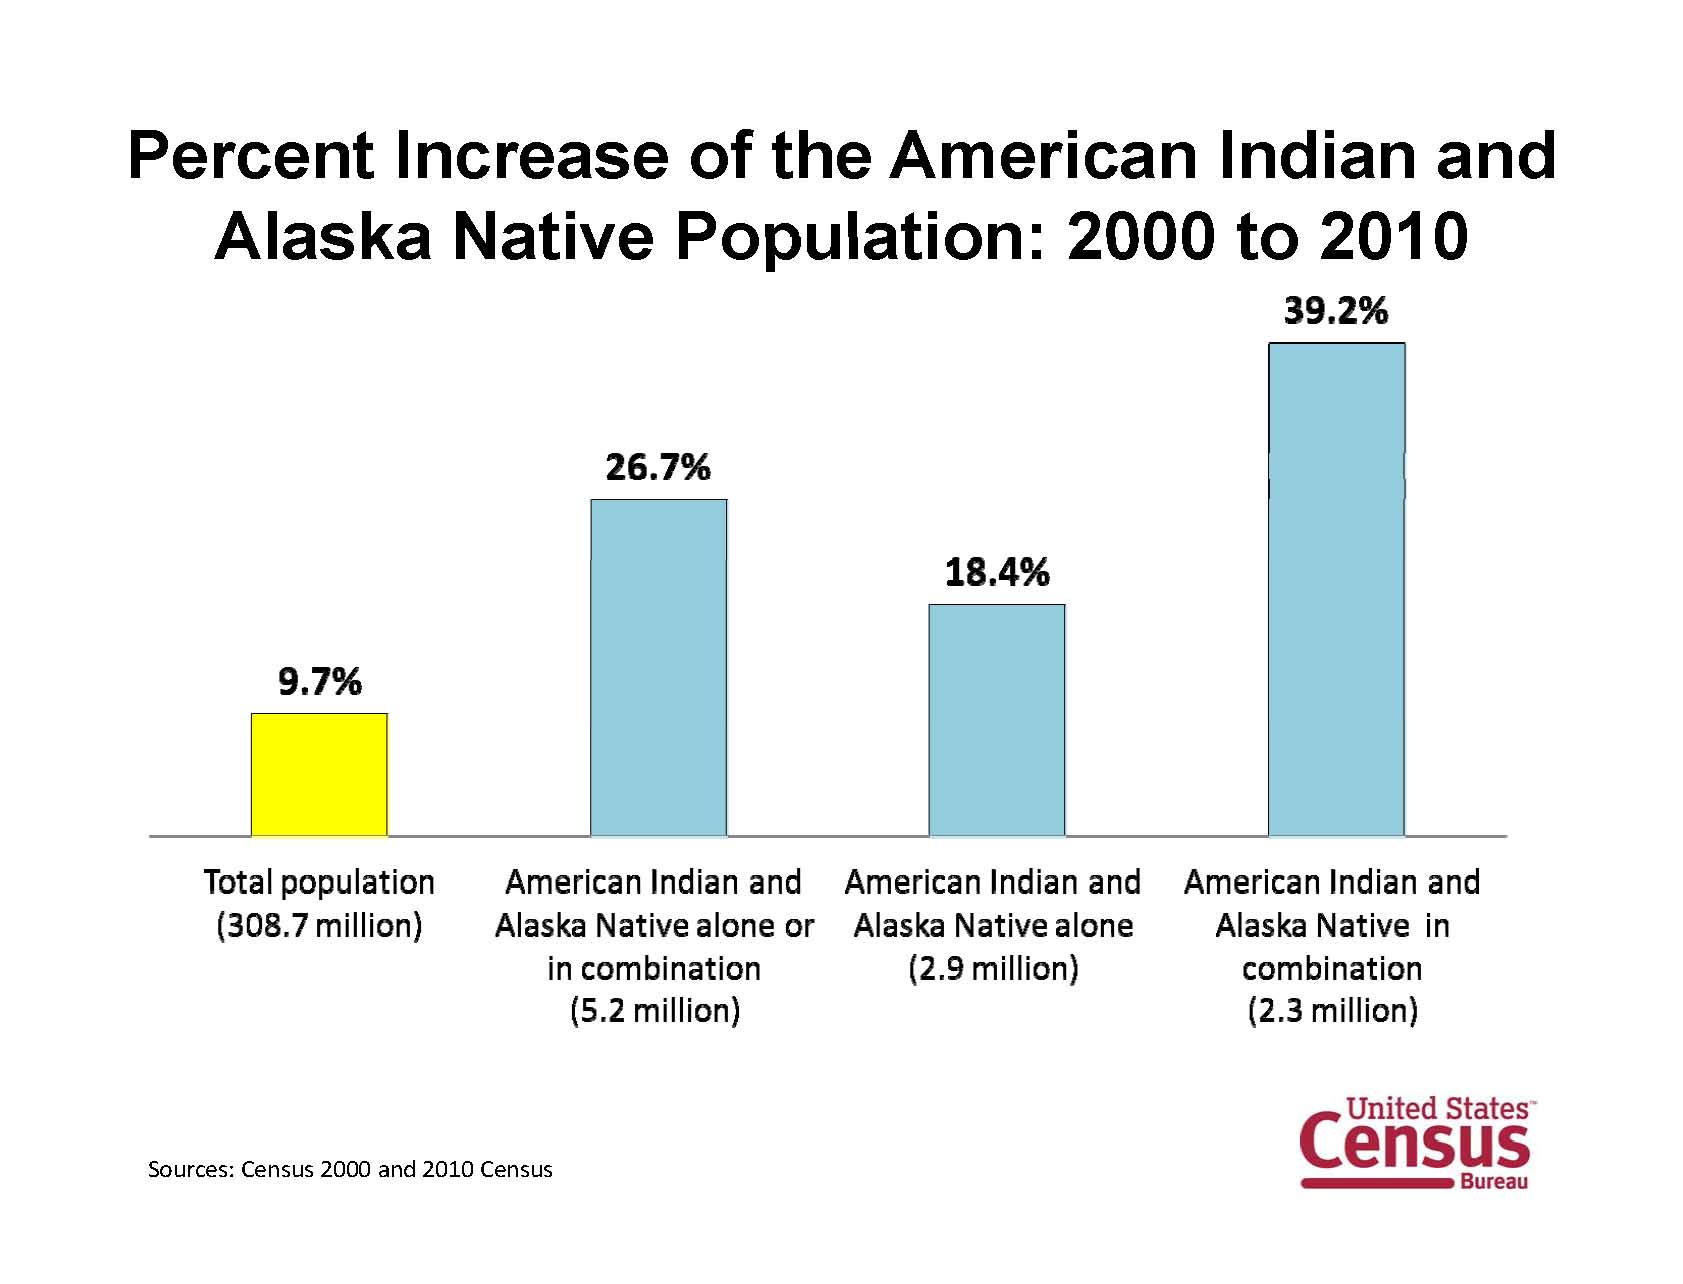
The Census Bureau has delivered its many 2010 Census and American Community Survey data products on time and on budget, including the statistics used by states in their redistricting and providing valuable local insights that paint a portrait of America. The ACS provides the most timely estimates available for thousands of small places and population groups on key social and economic attributes. For many of these places and groups, these are the only detailed socioeconomic characteristics available. In the Fall of 2011 the Census Bureau produced detailed statistics for over 700,000 distinct geographic areas, permitting local governments and businesses to make the case to new employers about the value of building new job producing activities in their locales.
 
Feeding the Nation's Appetite for Data:

Here at the Census Bureau, we know that our users want more statistical information; they want it in a more timely fashion; they want it on smaller geographic areas and subpopulations. So we're supplementing our talent in small area estimation, hopefully increasing the breadth of our estimates in many programs. We're redesigning the way that users can access our statistical information on the Web. We want everybody to be able to access our estimates on the Web using any device they happen to use. We are building new statistical products by combining multiple data sets behind our firewalls. We are investing in visualization tools to widen the audience of our statistical information. We will extract more information from the same data sources by increasing our analysis of the data we collect.

This coming year we will see more with our Web transformation and with new tools like the economic indicator dashboard and the county business and demographics map. We will also be gearing up for the Economic Census, and working hard to increase access to our data and participation in our surveys so we can continue to provide quality statistics about the nation's people, places and economy.

Census Bureau Releases New Race and Ethnic Demographic Information from the 2010 Census

Census Bureau Releases New Race and Ethnic Demographic Information from the 2010 Census

The U.S. Census Bureau today released the first in a series of new, detailed demographic information from the 2010 Census for up to 331 different race and ethnic groups down to the census tract level for Nevada and New Mexico. Data for remaining states will be released on a rolling basis through April, 2012. National level data will be released in May.

These Summary File 2 tables add a new layer of detail to the population and housing topics released earlier this year from the 2010 Census. Information, such as age, relationship and homeownership, previously available only for an area's entire population is now available for specific race and ethnic groups in that community.

Each Summary File 2 table is presented for up to 331 population groups. These include iteration groups for the total population, race alone groups, race alone or in combination groups, multiple-race combinations, American Indian and Alaska Native tribal groupings, detailed Asian groups, detailed Native Hawaiian and Other Pacific Islander groups, detailed Hispanic groups, and race/Hispanic groups. Release

2010 Census Shows Nation’s Hispanic Population Grew Four Times Faster than the Total U.S. Population, While Overall Population is Aging

Official census taker pushing a doorbell

The U.S. Census Bureau today released two 2010 Census briefs summarizing important demographic trends on the Hispanic population and Age and Sex Composition in the United States over the past decade.

The Hispanic Population: 2010 looks at an important part of our nation’s changing ethnic diversity with a particular focus on groups of Hispanic origin, including Mexican, Dominican and Cuban. Between 2000 and 2010, the Hispanic population grew by 43 percent – four times the 9.7-percent growth of the total U.S. population. The increase was a difference of 15.2 million people and accounted for more than half of the total population increase of 27.3 million people.

Age and Sex Composition: 2010 reports on our nation’s changing age and sex composition and shows that while Americans have gotten older, the male population has grown faster than the female population over the last decade. Of the total 2010 Census population, 157.0 million people, or 50.8 percent, were female and 151.8 million, or 49.2 percent, were male. 

For more information on today’s 2010 Census releases, visit www.2010.census.gov/news.

Plato, Mo. Celebrates Recognition as the 2010 Census U.S. Center of Population

In the photo are (left to right) Dr. Robert Groves, Juliana Blackell & Bob Biram  - Village Chairman.

Townspeople, elected representatives, government officials and hundreds of students today celebrated the naming of Plato, Mo., as the 2010 Census U.S. center of population. Amid music, speeches, banners and cheers, village chairman Bob Biram welcomed the crowd, saying, “We’re proud of our village. As one of our students said, ‘we were in the middle of nowhere; now we are in the middle of everywhere.’"

At the event, U.S. Census Bureau Director Robert Groves and Juliana Blackwell, director of the National Oceanic and Atmospheric Administration’s (NOAA) National Geodetic Survey, revealed a survey disc, commemorating the national center of population as calculated by the Census Bureau and measured by the National Geodetic Survey.

Each decade after tabulating the decennial census, the Census Bureau calculates the mean center of population for the country, as well as for each state and county. The national center of population is determined as the place where an imaginary, flat, weightless and rigid map of the United States would balance perfectly if all 308,745,538 residents counted in the 2010 Census were of identical weight.  Press release

U.S. Census Bureau Released Most Detailed Data Yet from 2010 Census

Image of interactive map

The Department of Commerce's U.S. Census Bureau has begun releasing the most detailed data yet from the 2010 Census, including information on age and sex distributions, race, ethnicity, housing and relationships. This Profile of General Population and Housing Characteristics: 2010 was released this week for the first set of states and will continue to be released throughout the month of May for all 50 states, D.C. and Puerto Rico.

Demographic profiles are now available for the District of Columbia, Florida, Kentucky, Maine, Massachusetts, Michigan, Mississippi, New Mexico, North Dakota, Rhode Island, South Carolina, Tennessee and West Virginia. The release includes more than 150 data items in all in addition to percentage distributions.

The Census Bureau has also created an interactive map so you can explore the data down to the city level. By clicking the tabs at the top of the map, you can find demographic data for your location and make population comparisons between communities across the country. To learn your state’s median age, average household size, and percentage of renters versus homeowners, read the Census Bureau’s press release.

U.S. Census Bureau Completes Delivery of State 2010 Census Population Totals for Legislative Redistricting

The U.S. Census Bureau announced this week that 2010 Census population totals and demographic characteristics have been released for communities in all 50 states, the District of Columbia and Puerto Rico – ahead of the April 1 deadline. The data have provided the first look at population counts for small areas and race, Hispanic origin, voting age and housing unit data released from the 2010 Census. With the release of data for all states, national-level counts of these characteristics are now available.

In April, the Census Bureau will release the National Summary File of Redistricting Data, providing the same population, housing unit counts and demographic characteristics for the United States and other cross-state geographies, such as regions, divisions, metropolitan areas and American Indian, Alaska Native and Native Hawaiian areas.

Census data are now being used by state officials to realign congressional and state legislative districts in their states, taking into account population shifts over the last decade.

Find more information about the redistricting data program or to find news releases and data for your state.

U.S. Census Bureau Launches Interactive Map of Local 2010 Census Data

2010 Census Redistricting Data Release by State

The U.S. Census Bureau has launched a new, interactive map that conveniently and easily displays local-level 2010 Census population counts. The application allows users to compare county-level population change from 1960 to 2010, as well as state-level data on race and Hispanic or Latino origin for 2010.
 
Last week, the rollout of detailed data began with the release of local population counts for Louisiana, Mississippi, New Jersey and Virginia. This week, local data for Arkansas, Indiana, Iowa, Maryland and Vermont are being released. For each state, the Census provides summaries of population totals as well as data on race, Hispanic origin, and voting age for multiple geographies within the state, such as census blocks, tracts, voting districts, cities, counties and school districts. The counts are being delivered on a state-by-state basis, and all states will receive their data by April 1.

As new data is released, the Census Bureau will update the map. Learn more about your state.

Census: The 2010 Holiday Season

Commerce headquarters with holiday wreaths

The holiday season is a time for gathering with friends and family to reflect and give thanks. At this time of year, the Department of Commerce’s U.S. Census Bureau presents holiday-related facts and figures from its data collection, including details about mail, retail sales, toys, trees and decorations and much more. The Census Bureau this week announced the nation’s population at 308,745,538 as of April 1 for the 2010 Census. Happy holidays from the U.S. Department of Commerce!  Holiday facts and features

Secretary Locke Delivers 2010 Census Counts, Announces Nearly $1.9 Billion in Savings

Secretary Locke Introduces the Results of the 2010 Census

U.S. Commerce Secretary Gary Locke joined Acting Deputy Secretary Rebecca Blank and Census Bureau Director Robert Groves at the National Press Club today to unveil the official 2010 Census population counts – 10 days before the statutory deadline of Dec. 31. The nationwide population as of April 1, 2010 was 308,745,538. Locke also announced a final 2010 Census savings of $1.87 billion.

“Without the help of the American people and the more than 257,000 partner organizations that worked with the U.S. Census Bureau to raise awareness and encourage participation, we would not have been able to achieve $1.87 billion in 2010 Census savings and a final mail response rate of 74 percent in a time of declining survey participation,” Locke said.  

The 2010 Census counts show how the U.S. population has grown and shifted over the last decade. More than $400 billion in federal funds are distributed every year to states and communities based in part on Census population data and American Community Survey (ACS) results. State and local governments use this data to plan new roads, new schools and new emergency services, and businesses use the data to develop new economic opportunities. | Full DOC release | Census Bureau release  | Noticias en español | More releases and data

U.S. Census Bureau Releases First of Three Major December Data Releases

Total Population by Age: April 1, 2010The U.S. Census Bureau today released its 2010 Demographic Analysis estimates at a news conference at George Washington University – the first of three major Census Bureau releases in December. The data involve five series of national-level estimates of the population by age, sex, two race groups (black and non-black) and Hispanic origin (for under age 20). Demographic Analysis attempts to estimate the national population of 2010 but uses a very different technique than is used for the 2010 Census. Demographic Analysis estimates are developed from historical vital statistics and estimates of international migration. Separate from 2010 Census counts, these estimates provide one way of measuring the size of the U.S. population and will be used to analyze the 2010 Census results coming later this month.

On Dec. 14, the Census Bureau will also release American Community Survey (ACS) data for the 5-year period from 2005 to 2009. The ACS is a sample survey sent to 3 million households every year that provides vital social, economic, housing and demographic characteristics about our country. This is the first set of 5-year estimates for the ACS, which every year will produce more than 11 billion pieces of data covering some 670,000 geographical areas, including every county and community in the country.

Finally, by Dec. 31 as required by law, the Census Bureau will report the first set of data from the 2010 Census: the national and state populations as well as the apportionment of seats to each state in the U.S. House of Representatives. See today’s Demographic Analysis press release and the complete Demographic Analysis tables. Visit http://www.census.gov/ to learn more about upcoming Census releases.

U.S. Census Bureau to Provide Insight into Nation's Population with Upcoming Data Releases

Image of Robert Groves on podiumCommerce's U.S. Census Bureau today hosted a press briefing at the National Press Club in Washington, D.C. to provide an update on census operations, detailing the steps required to both process and evaluate the 2010 Census data collected from over 130 million U.S. households. Census Bureau Director Robert Groves explained that the 2010 Census numbers are just one part of a series of data releases coming out in the months ahead that provide information about our nation’s population.  

On December 6, the Census Bureau will release a set of national population estimates called Demographic Analysis that are based on historical data of births, deaths and estimates of in- and out-migration. Later in December, the Census Bureau will release the first-ever set of five-year American Community Survey (ACS) data. These detailed data are essential to the understanding of our nation and our ability to make informed decisions about the future of our communities.

By the end of December, the Census Bureau will release the first 2010 Census data: the total population for the nation and states, and the apportionment counts allocating congressional seats by state. For more information, visit http://2010.census.gov/2010census/

Secretary Locke Commends the Nation’s Strong Participation in the 2010 Census as Final Numbers Come In

Census 2010 logoSecretary Locke congratulated the nation today on its strong participation in the 2010 Census after the U.S. Census Bureau released the final mail participation rate of 74 percent, matching the final mail participation rate achieved in the 2000 Census. More than 22 states, 1,553 counties, and 278 cities and other geographies met or exceeded their 2000 Census participation rates. 

“I’d like to thank the American people for their cooperation and participation in the 2010 Census,” Locke said. “With their help, we were able to match the participation rates of 2000 in a time of declining survey participation and save taxpayer money by reducing the need for costly door-to-door follow up.”  

America’s strong mail participation is part of the reason the U.S. Census Bureau was able to announce $1.6 billion in 2010 Census operational savings in August.  More than 250,000 partner organizations and a far-reaching communications campaign helped alert people across the country about the importance of mailing back their 2010 Census form.

Find your area’s final mail participation rate on the 2010 Census’s interactive “Take 10” Map at http://2010.census.gov/2010census/take10map/2010textview.php.   Release  |  Census release

Secretary Locke Announces $1.6 Billion in 2010 Census Savings

Secretary Locke gestures with his hands on podium

Effective public outreach campaign and careful management save taxpayer dollars

U.S. Commerce Secretary Gary Locke announced today that the Commerce Department’s U.S. Census Bureau is returning $1.6 billion in 2010 Census operational savings.

In the first full year of Census management by Obama administration officials and in a time of tightened federal resources, the Census came in 22 percent under budget. The savings occurred primarily because contingency funding set aside for disasters or major operational failures was not tapped and because the Census questionnaire mail-back response rate and workforce productivity across field operations both beat expectations.

In the years leading up to the 2010 Census, operations had been beset by a costly IT systems development. Upon taking office in 2009, Locke and Census Bureau Director Robert Groves heard warnings from Congress and Census watchdogs about the many high-risk operational challenges ahead and about the numerous systems failures in the years preceding the 2010 count. Importantly, response rates to surveys had been declining for years, and if that trend had held true for this decade’s census, it would have added hundreds of millions to the cost of the door-to-door follow-up effort.

“In early 2009, the 2010 Census was in need of top-notch operational and fiscal management,” Locke said. “The Census is a massive undertaking with great risk for operational problems and cost overruns. We appointed Dr. Groves to execute the 2010 Census with a directive to run a successful, non-partisan Census that counted everyone. Just as importantly, the President and I directed Dr. Groves to run a comprehensive review of the Census plan and find ways to cut costs and enumerate the population more efficiently. Over the last 17 months, we have worked tirelessly to ensure American tax dollars were being spent wisely.”  Read more   |  en español  |  RemarksWhite House blog  |  Census Director's blog